

The flash spectrum of the chromosphere
Spectroscopy during a solar eclipse
A total solar eclipse offers the opportunity to capture an emission spectrum of the chromosphere.
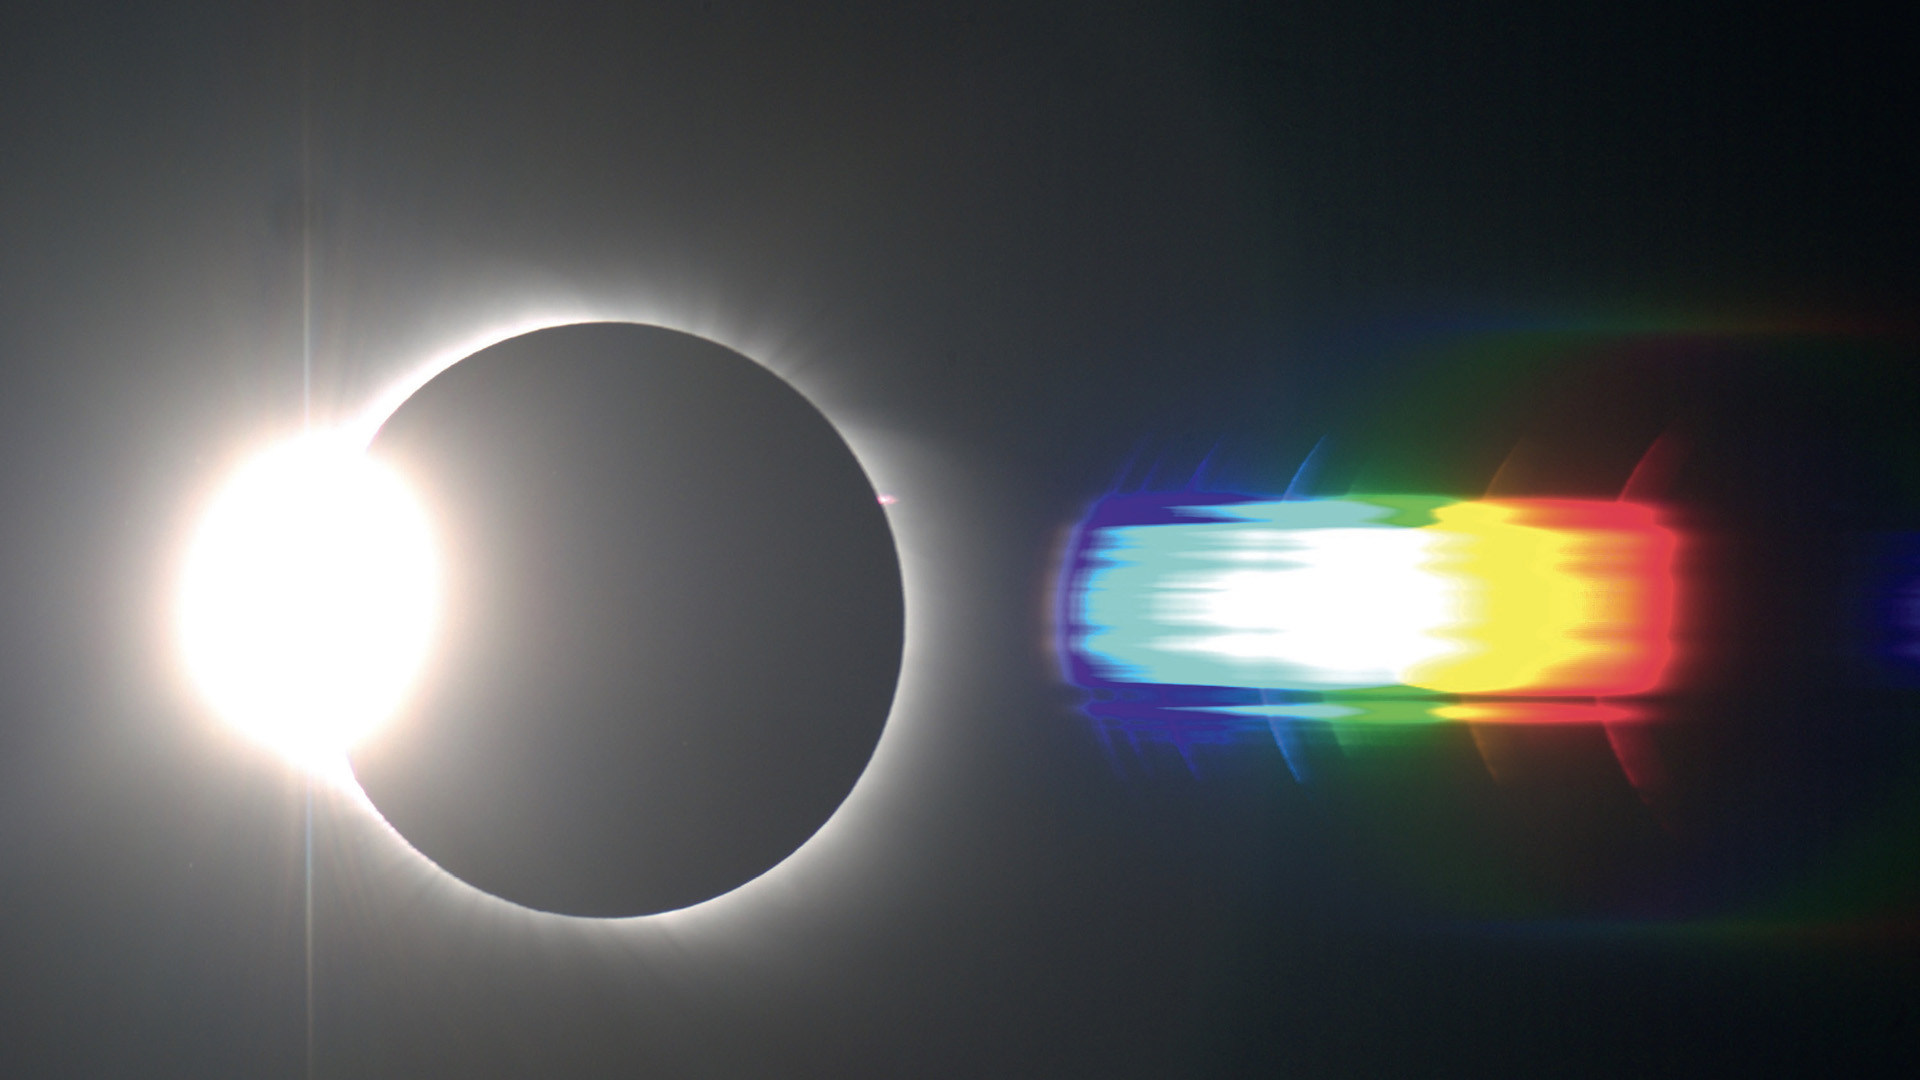 The flash spectrum from the total solar eclipse on 1.8.2008. The most prominent emission lines are identifiable and marked. Bernd Gährken
Take spectacular photos of the Sun’s corona and an extraordinary image of the chromosphere: a so-called flash spectrum!
The light of the photosphere and the scattered light that causes our atmosphere dominate everyday solar observation. The chromosphere’s emission lines remain invisible because their luminance is much weaker since they are emitted in all directions. It only stands out when we look at the chromosphere beyond the Sun's edge in isolation, thereby allowing the glow of various elements in the plasma of the upper layers to become visible. However, such observations are only possible with greater technical effort.
A new element
It is different when the Moon covers the solar disc. A total solar eclipse therefore offers the perfect opportunity to capture an emission spectrum of the chromosphere using basic equipment. If it works, the result is several images of the chromosphere arranged side by side in different colours, each of which originates from an emission line. Most dominant are the hydrogen lines in the Balmer series, calcium H and K and the single ionized helium. The latter was discovered as an element using this method in 1868.
The term "flash spectrum" was coined by C.A. Young (1870) and comes from the short period of time during which the emission lines of the chromosphere are visible. The chromosphere is only a thin layer compared to the overall diameter of the Sun. Since the total eclipse phase lasts only a few minutes, the phase in which the chromosphere is at its optimum visibility is just a few seconds. From our point of view, the chromosphere has an angular diameter of only around 10". The Moon moves relatively quickly so good timing is required for photography. The flash spectrum can only be captured directly at the beginning or end of totality.
The corona, a hot, thin gas, also has its own emission line spectrum. However, due to its higher temperature, its lines are different to those of the chromosphere. But the corona does not have such sharp structures, so the resulting spectrum is diffuse and emission lines are difficult or impossible to identify without using a slit.
Creating the spectrum
Slit-less spectroscopy is used to break the light down into its colours, thereby splitting the entire image of the chromosphere. A relatively low-cost way of doing this is by using a transmission grating: a plane-parallel glass with many fine parallel grooves or dark lines, on which the light is diffracted and brought to interference. Such gratings are available to buy in a standard 1.25" filter frame, which makes it easy to integrate into the beam path. For flash spectra, due to the limited time available, blaze gratings are of greater benefit compared to normal gratings with dark lines as the light yield in the spectrum is particularly high.
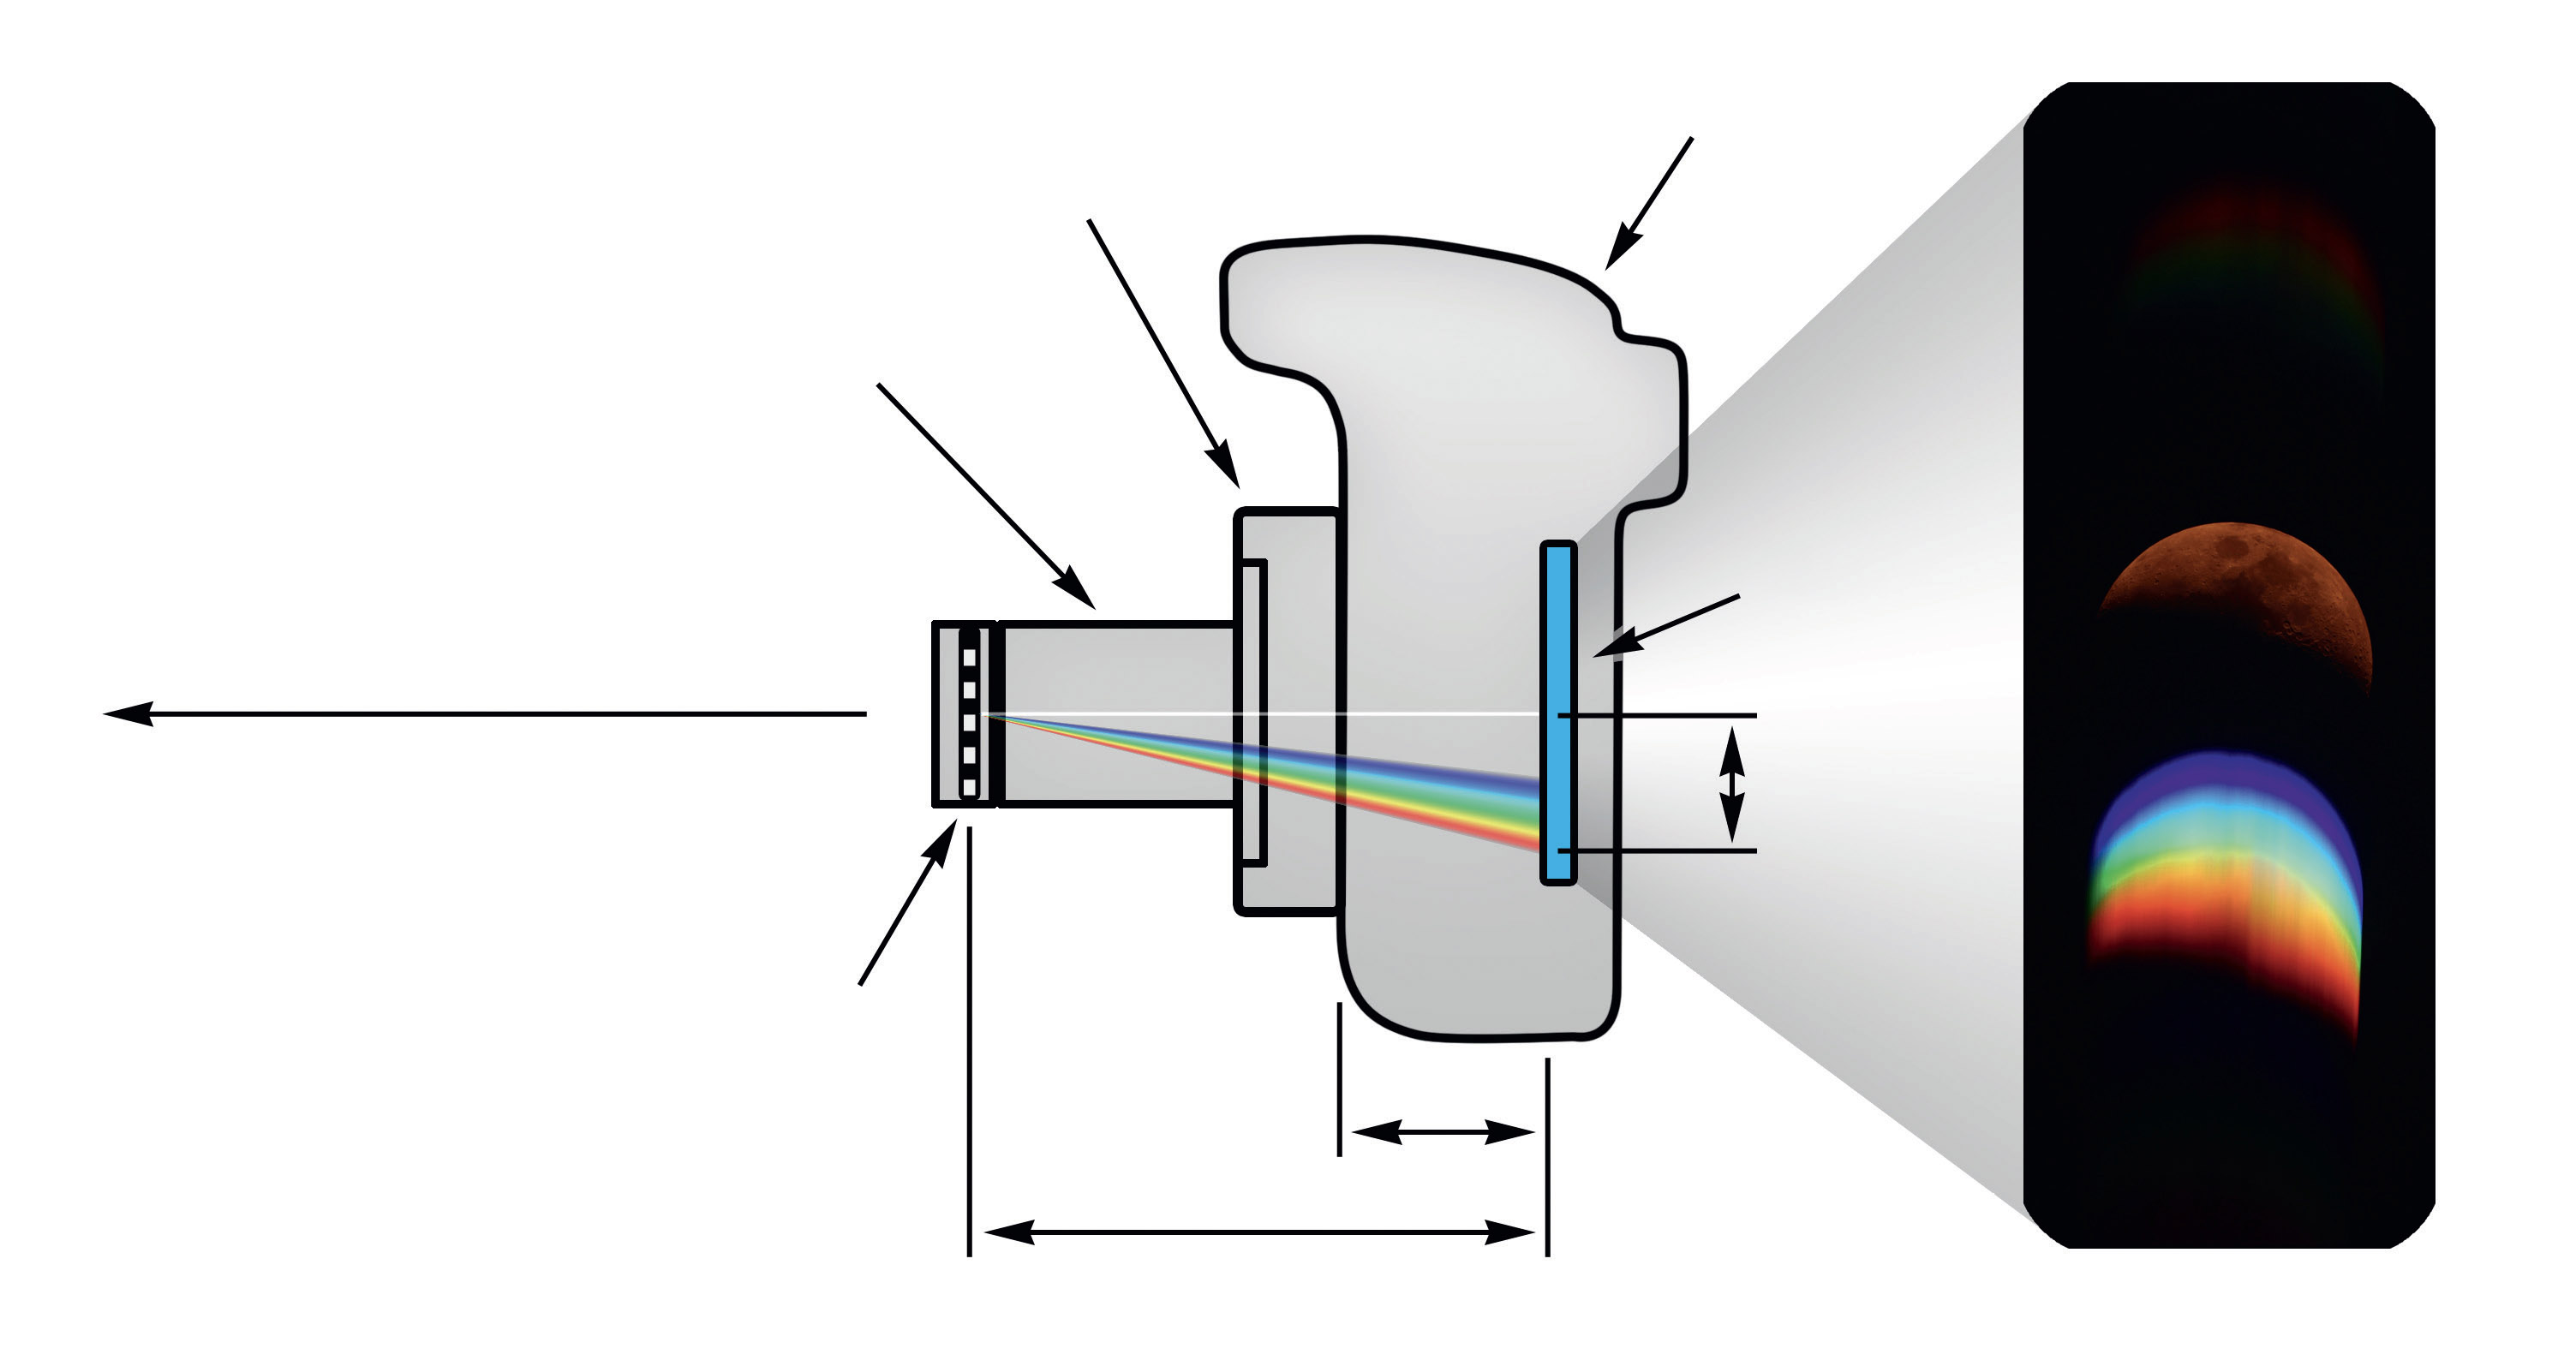 Configuration for capturing a flash spectrum consisting of a grating, 1.25" adapter, T-ring and DSLR. Distance A is camera’s flange focal distance, d is the distance between the grating and the sensor, and x is the distance between the 0 and 1 diffraction orders. On the right, an example of the Moon. M.Weigand
You will need to choose the optimal distance between the chip and the grating for a nice result, showing the spectrum of the chromosphere (1st order of diffraction) together with the "normal", eclipsed Sun (zero order mode). The diffraction angle depends on the wavelength λ and the number of grating lines per millimetre L. The most common gratings have 100 or 200 lines/mm. You can calculate the distance in mm x between the zero-order and a certain wavelength of the 1st order in the focal plane using the following formula:
X = d * λ * L * 1,000,000
Where d is the distance between the grating and the chip in mm, and the wavelength is given in nm, e.g. 400nm for the blue or 700nm for the red end of the spectrum. This allows you to calculate whether everything fits on the sensor.
For example: A 100-line/mm grating is screwed into a 1.25" socket, which in turn is connected to a DSLR via a T-ring. The typical flange focal length dimensions result in a grating-chip distance of approximately d = 90mm. The Hα line at 656nm is therefore displayed on the chip 5.9mm away from the object or the zero-order. The method can be safely tested for objects such as a bright star or the Moon. With quite simple means, you can create a flash spectrum of the chromosphere - a nice addition to the usual "pretty pictures". At the same time, you are also following the steps that led to the historical discovery of helium almost 150 years ago.
Author: Mario Weigand / Licence: Oculum Verlag GmbH